
Analysis
Via Internet in real time. 24 / 7 / 365.
Analysis module (data, graphics and analysis)
For working with data bases, graphic creation, plotters, multiplication, division, addition or subtraction of graphics, application of filters, offsets, etc.
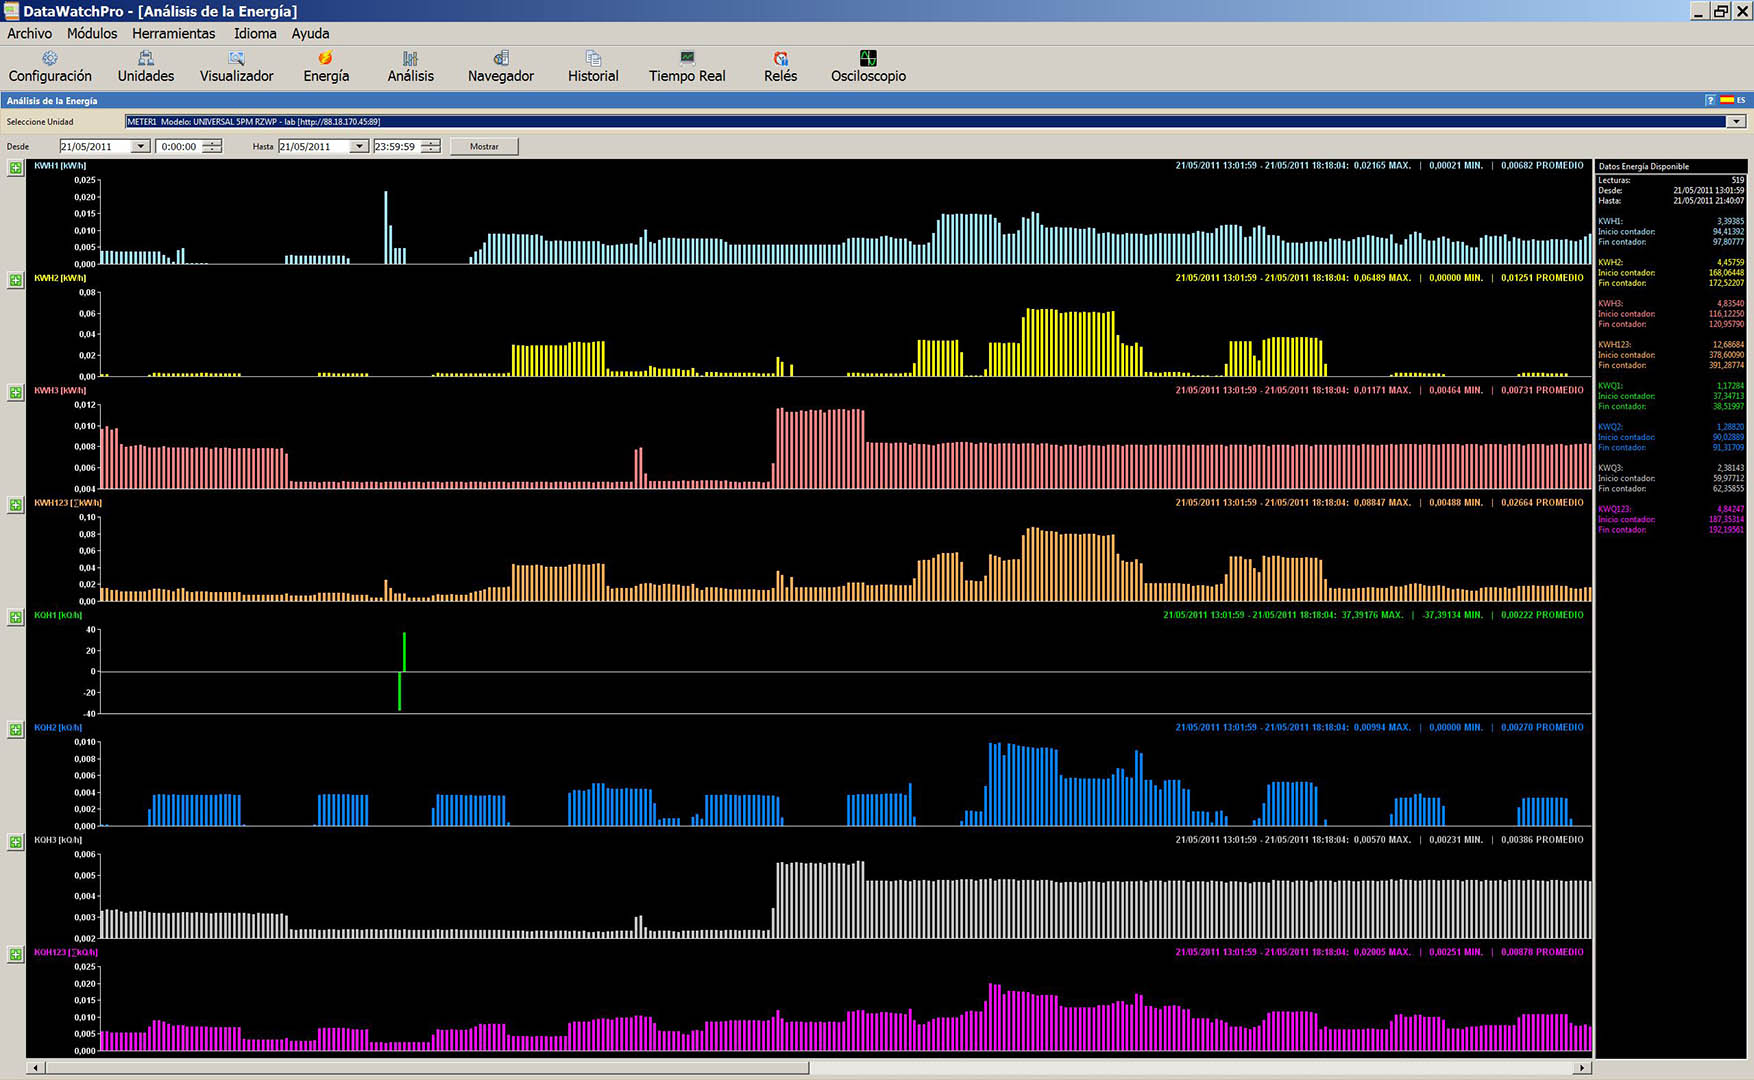
Energy analysis module
Graphic and numerical analysis of active and reactive energy consumption of lines 1, 2 and 3, as well as summary of same.
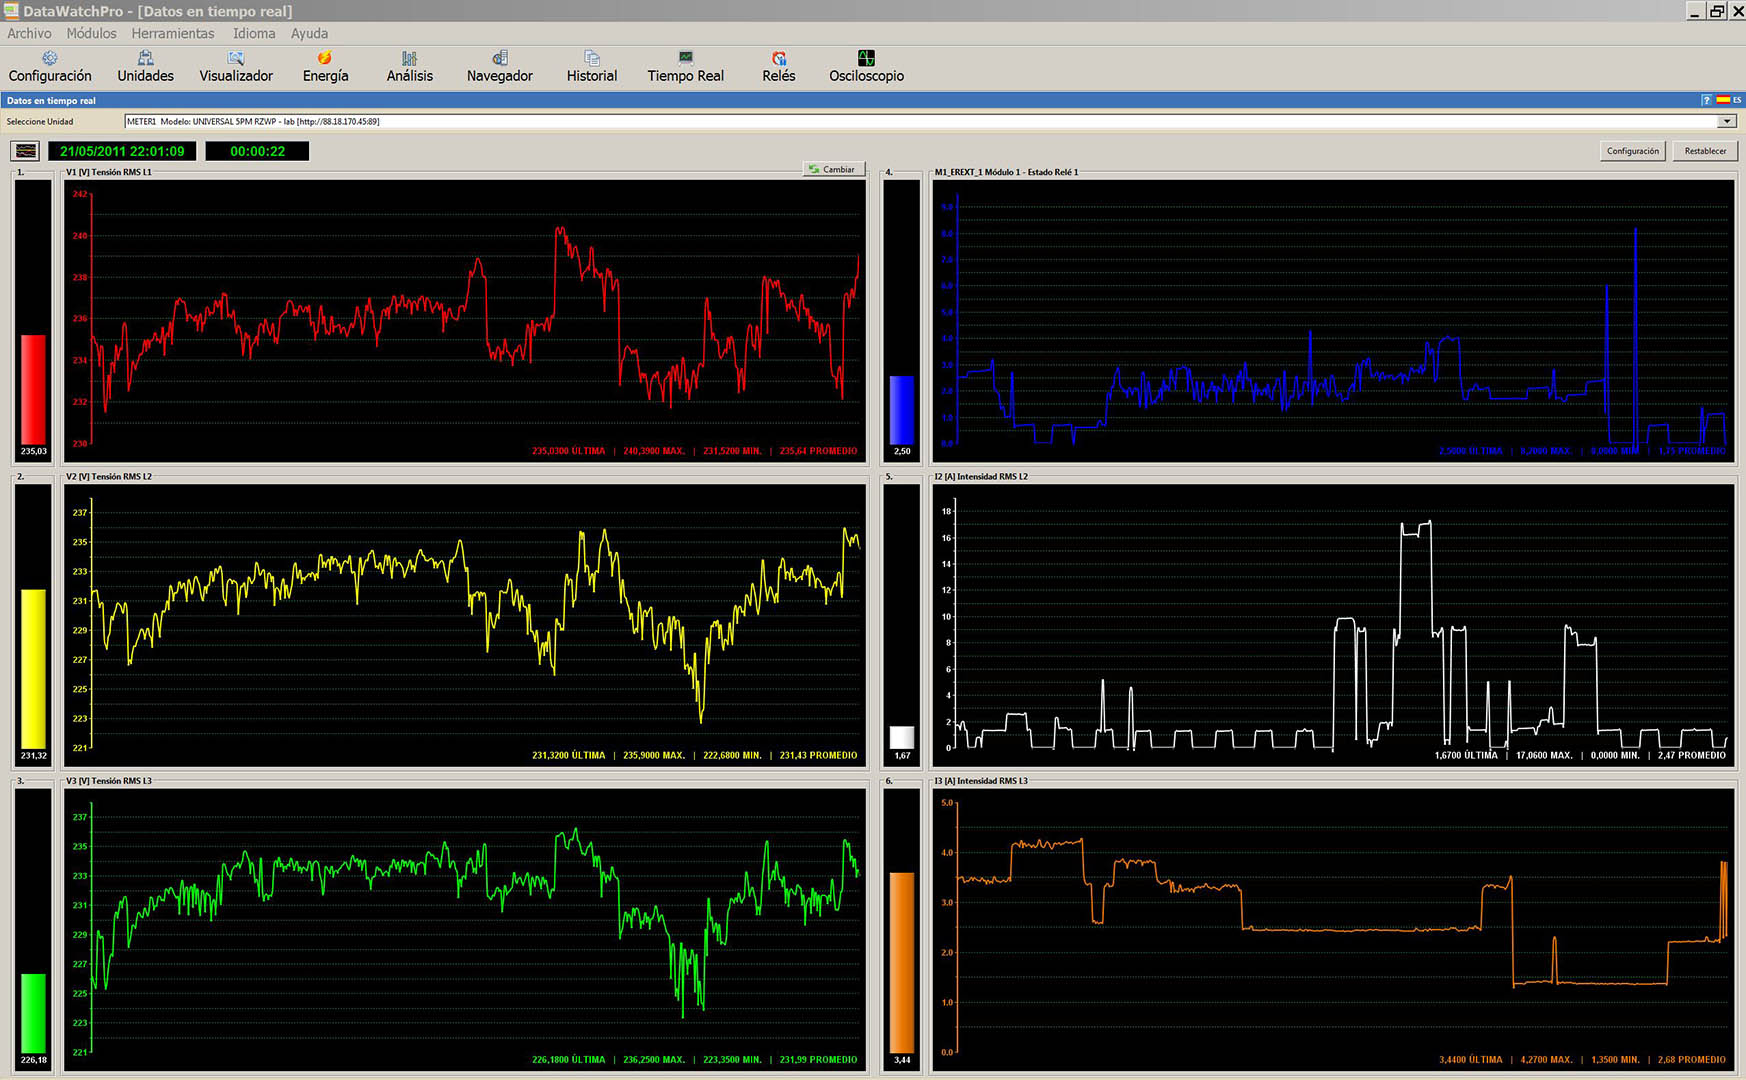
Real time analysis module
Real-time display of graphics of all paramenters as data is received.
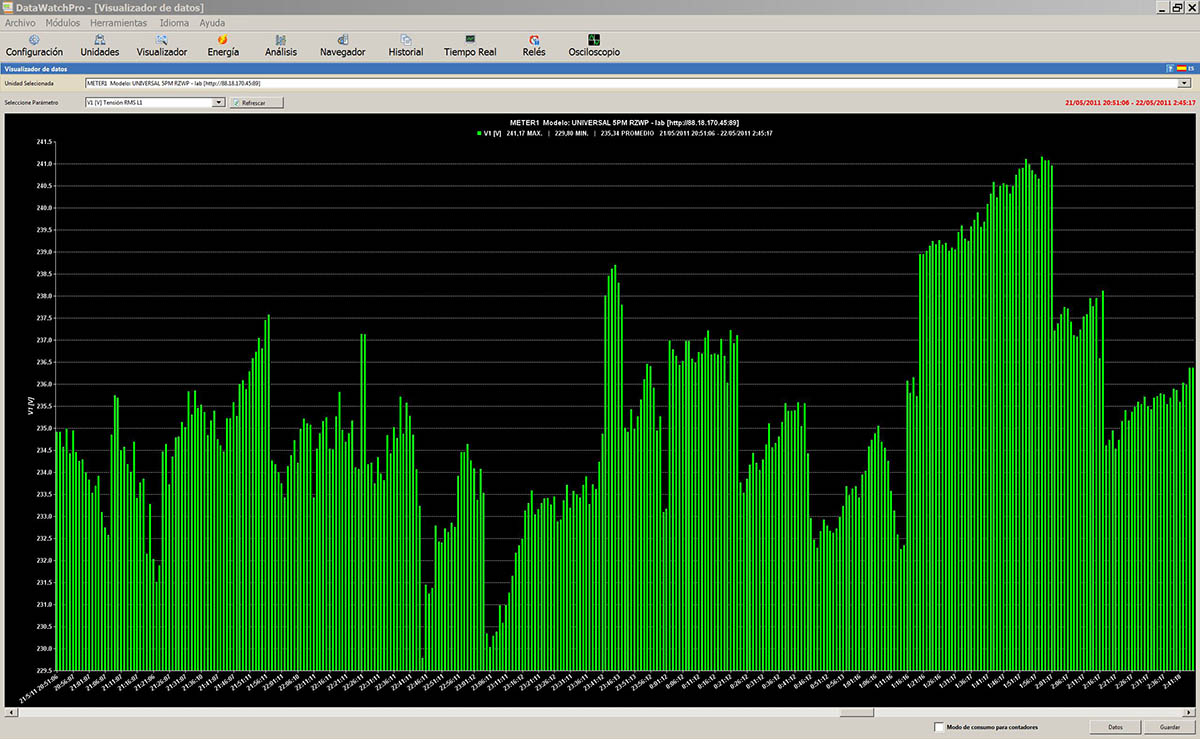
Display module
Permits one to visualize graphics of any given parameter. A graphic displays all data received at any given time as from start of session. Autoscale, maximum / minimum value, mean, consumption mode for counters.
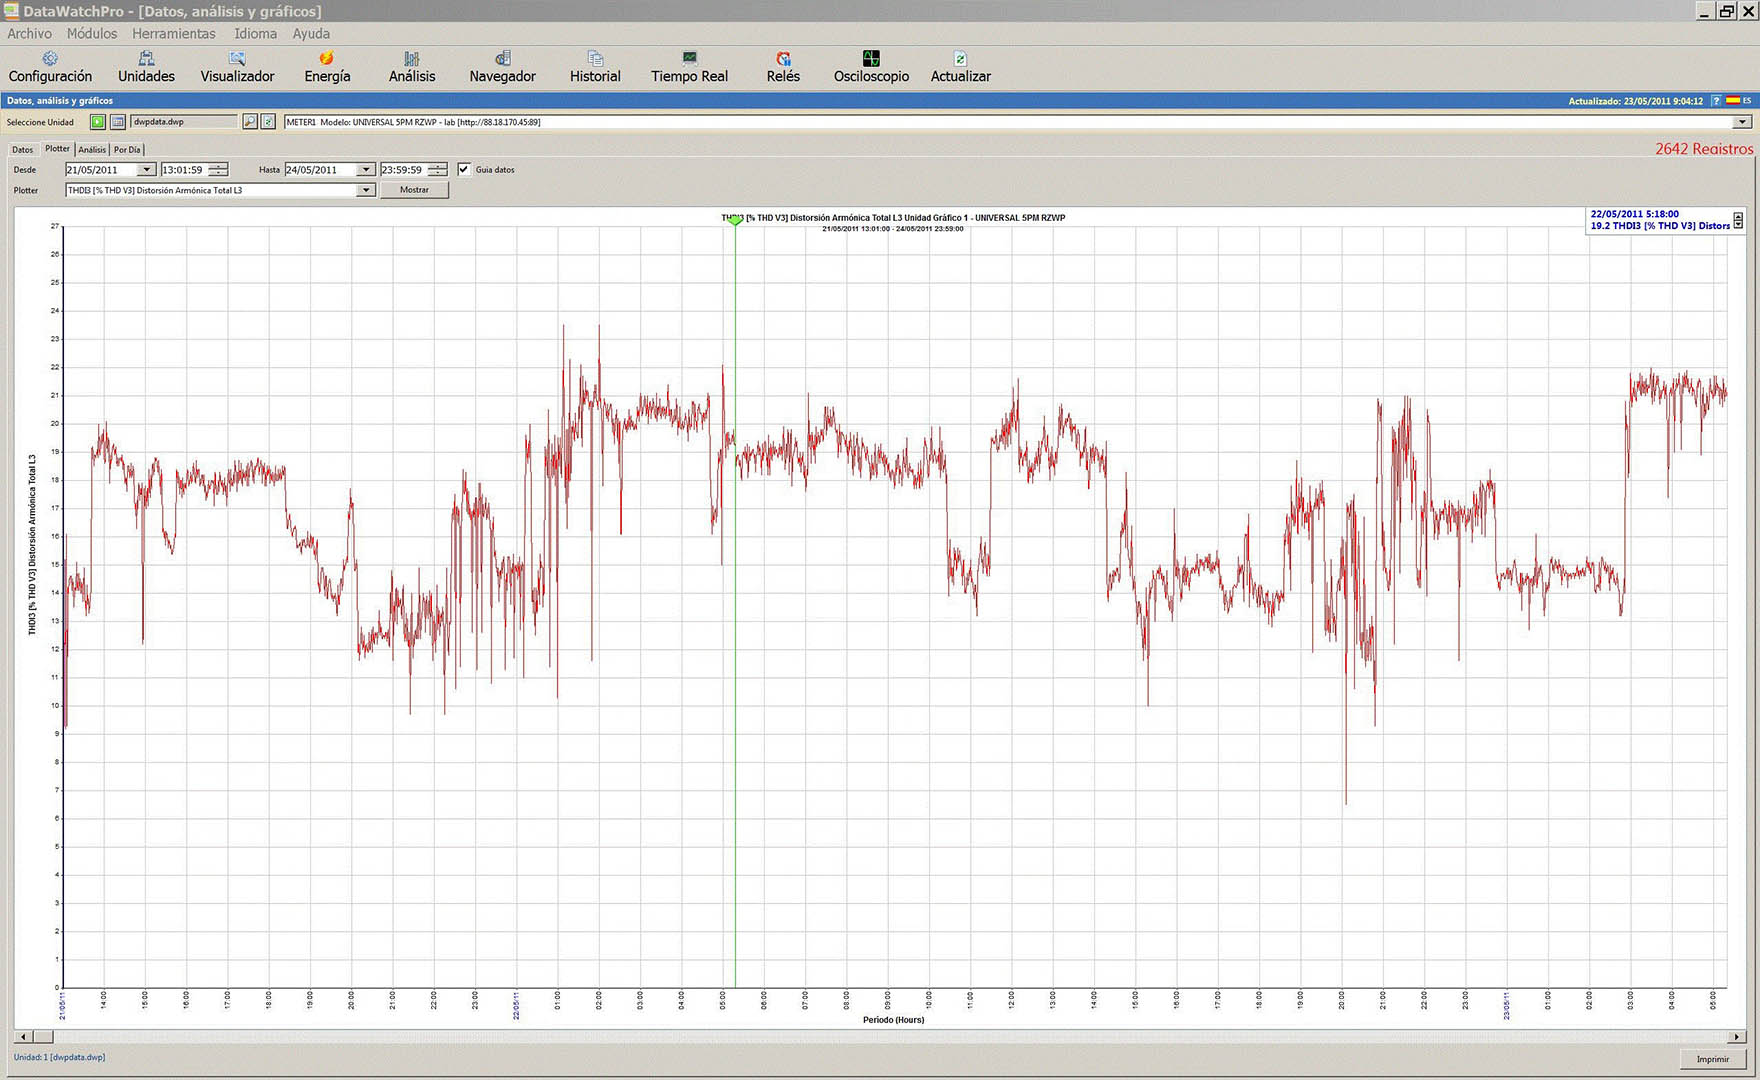
Graphic plotter module
The plotter offers a graphic display of given unit data and parameters. said graphic shows the evolution of any parameter within a set time slot (1 year), allowing one to surf through extended periods of time and see tendencies and points of the parameter.
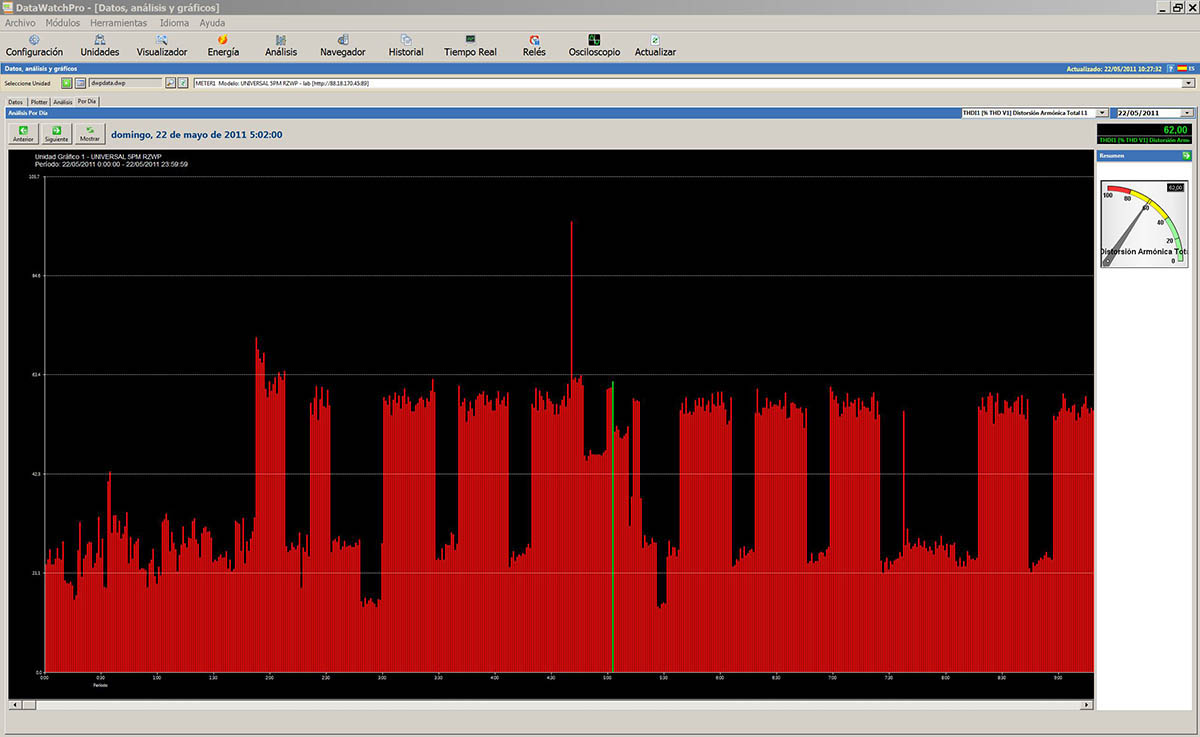
Daily analysis module
An analysis tool which permits one to surf the data in 24-hour time-slots. Each day a graphic is displayed corresponding to that day's available readings.
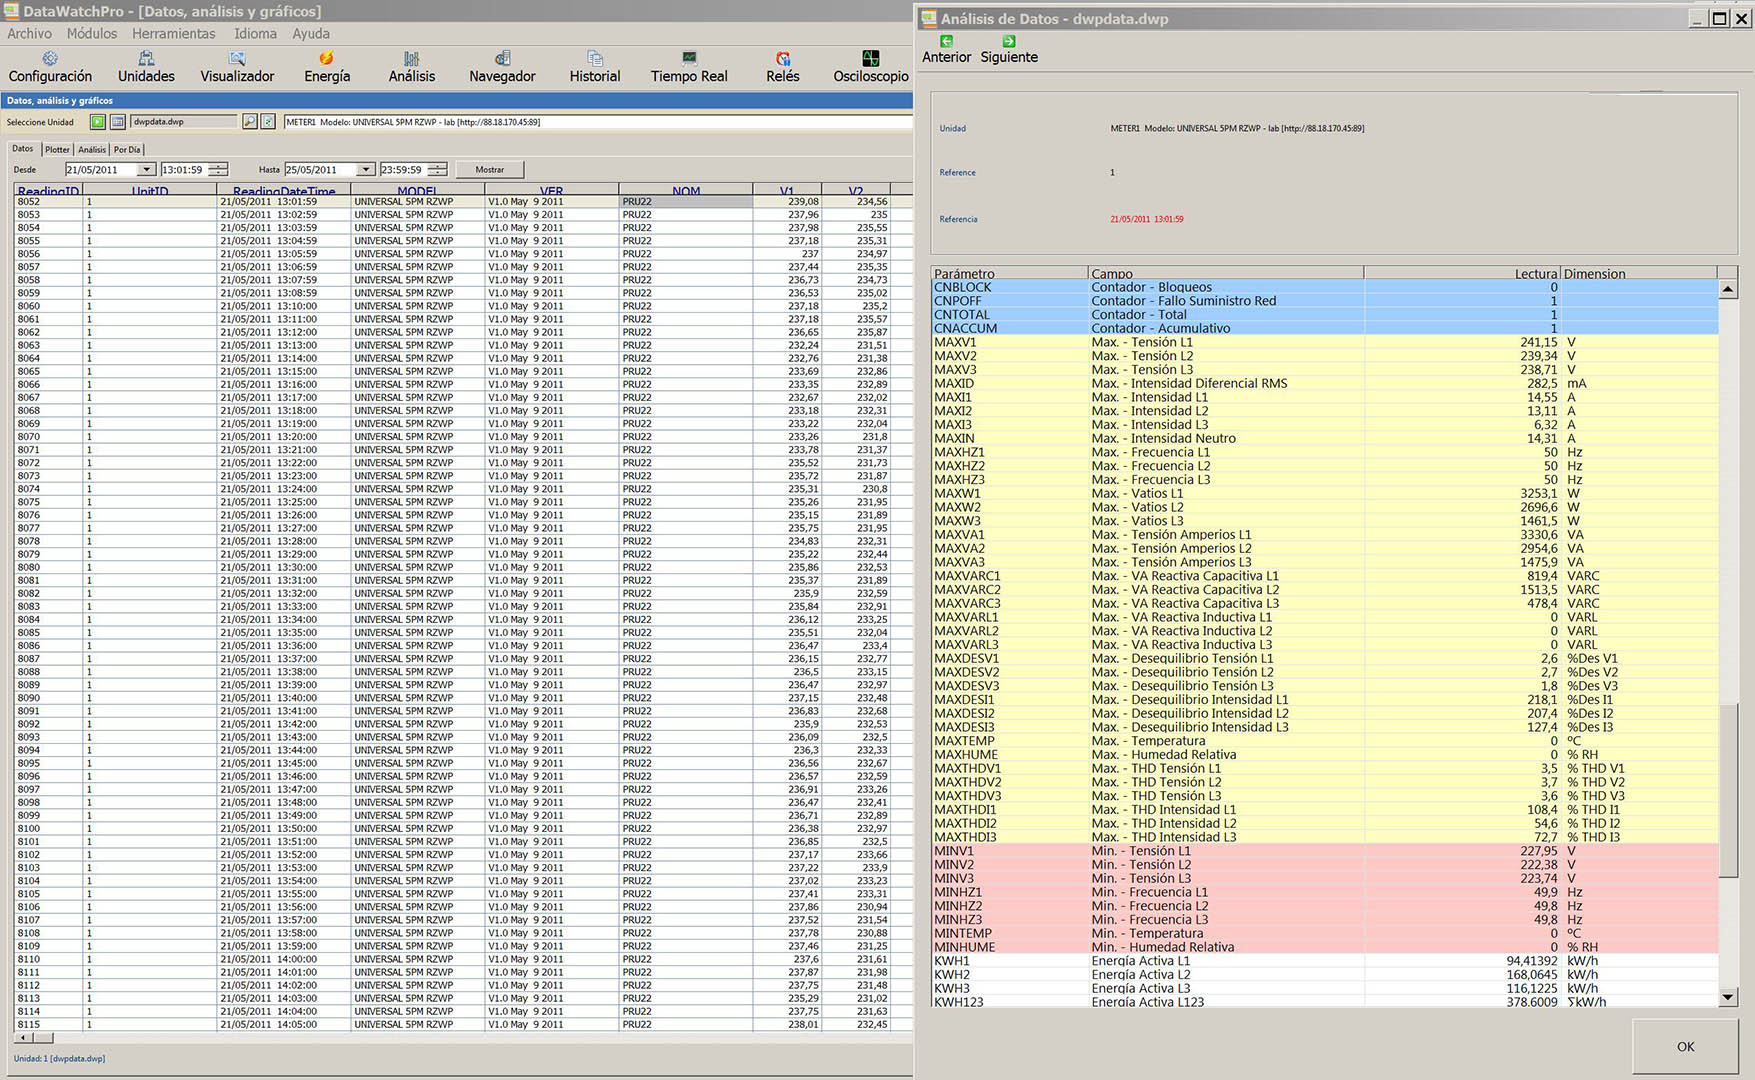
Data analysis module
Allows the user to see and analyse historical data of the selected units.
Log analysis module
All events are recorded chronologically as they occur.
